
Every rejected part costs a manufacturer twice — once in the material and time already spent making it, and again in the effort spent figuring out why it happened. Rejection analysis exists to make that second cost worth paying: turning a pile of rejected parts into a clear, ranked list of what is actually going wrong, so the same defect stops recurring instead of quietly repeating every shift.
This guide covers what rejection analysis is, the tools that structure it, the difference between scrap and rework, and a problem most rejection-analysis programs never catch — rejects that are not defects in the product at all, but errors in the instrument doing the inspecting.
| What is rejection analysis?
Rejection analysis is the structured investigation of rejected or defective parts to identify their root causes and reduce their recurrence. It typically combines defect classification, Pareto analysis to rank causes by impact, and root-cause tools such as cause-and-effect (fishbone) diagrams. A rejection is only meaningful once you know whether the part was actually defective, or whether the inspection instrument that flagged it was wrong. |
Rejection Analysis in Manufacturing: All You Need to Know
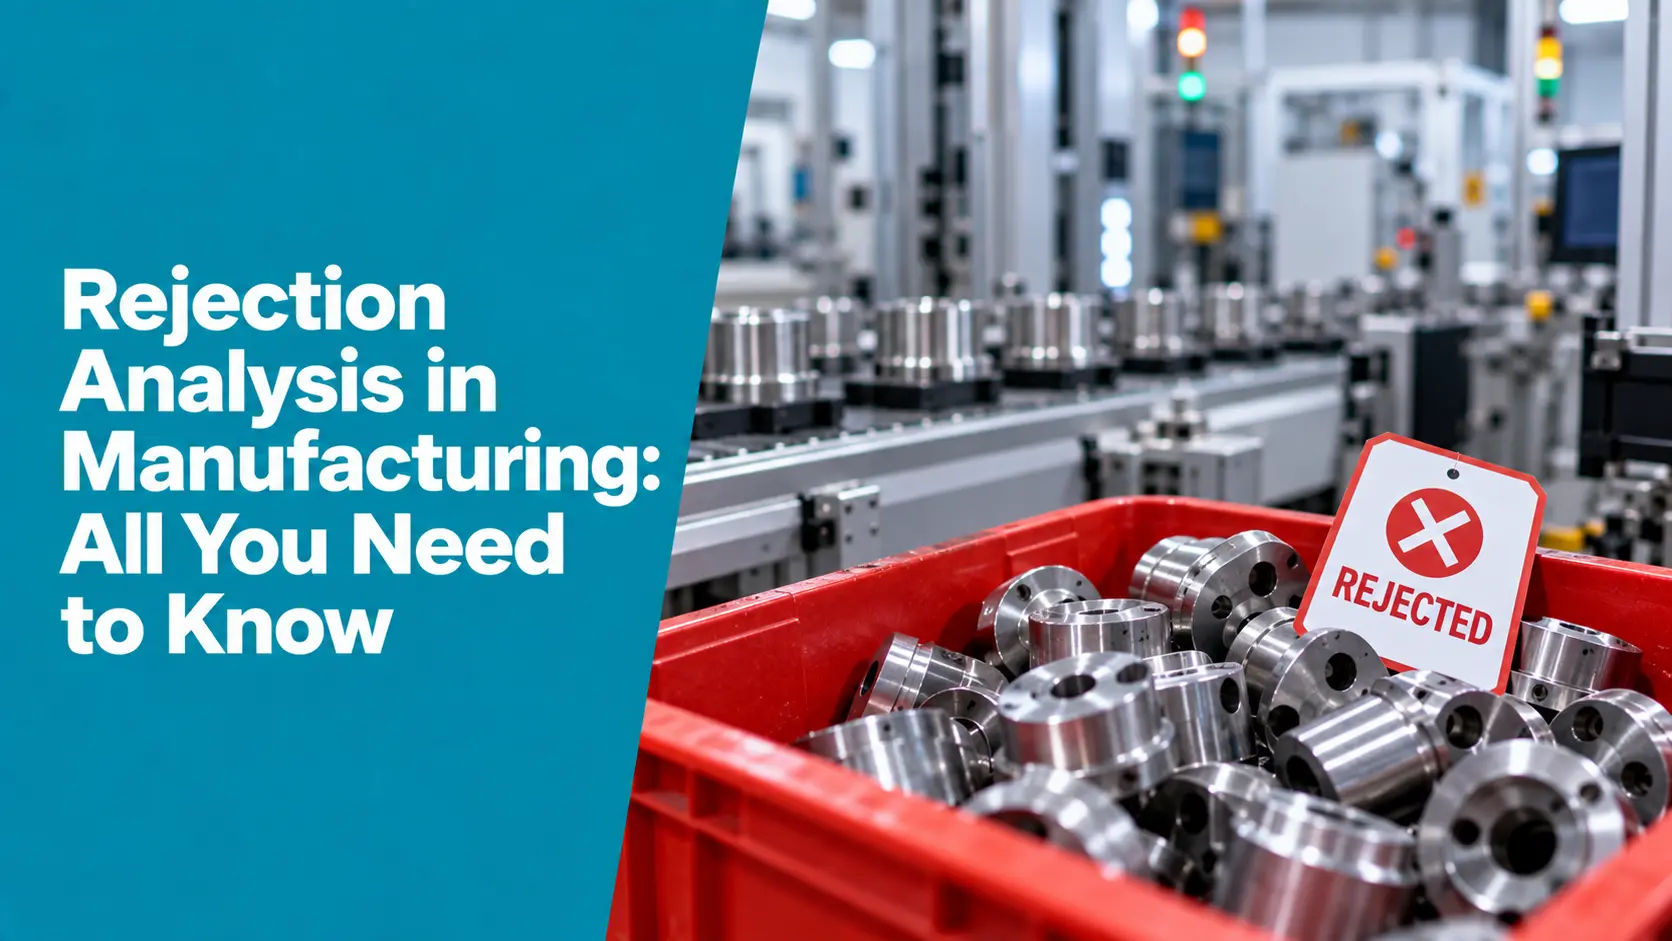
What Is Rejection Analysis?
Rejection analysis is the systematic study of why parts, components, or products fail to meet specification, so the underlying cause — not just the symptom — can be fixed. It sits inside the broader quality-control effort: every rejection is data about the process that made it, and analyzed correctly, that data points directly at what to fix. Analyzed carelessly, it produces a rejection rate on a report and nothing else.
Scrap vs Rework
Not every rejection ends the same way. A part is scrapped when it cannot be economically brought back into specification and is written off as waste. A part is reworked when a defined process can bring it back into specification, at the cost of extra labor and machine time. Both are real losses, but tracking them separately matters: a high scrap rate points to a process problem worth fixing at the source, while a high rework rate points to a cost quietly being absorbed by extra labor that a Pareto chart of rejection rates alone would never surface.
Common Causes of Rejection
- Process and equipment issues: dimensional deviation, surface defects, or missing features from an out-of-tolerance or malfunctioning machine.
- Material defects: incoming components or raw material that fail to meet specification before production even begins.
- Human error: skill gaps, incorrect setup, or inconsistent technique across shifts and operators.
- Tooling wear: worn tooling, fixtures, or dies that gradually drift out of spec long before anyone notices.
- Design issues: a design that does not account for real-world manufacturing tolerances or use conditions.
Tools Used in Rejection Analysis
| Tool |
Purpose |
| Check sheet | Structured, consistent data capture on defect type and frequency. |
| Pareto chart | Ranks defect causes by frequency or cost, isolating the few causes driving most rejections. |
| Cause-and-effect (fishbone) diagram | Maps potential root causes across categories — machine, method, material, manpower. |
| Control chart | Tracks rejection rate over time to distinguish a real shift from normal variation. |
| Disposition trend analysis | Tracks how rejection causes change over time, revealing slow drift a single snapshot misses. |
The Rejection Analysis Process
- Capture and classify: classify every rejected part by defect type, not just a single “rejected” total.
- Quantify impact: use a Pareto chart to rank causes by frequency or cost and focus effort on the top few.
- Find the root cause: apply a fishbone diagram or similar tool to trace each major defect back to its root cause.
- Act on the cause: fix the process, tooling, material, or training issue actually responsible.
- Verify and monitor: track the rejection rate afterward to confirm the fix worked and did not simply shift the problem elsewhere.
The Blind Spot: When the Rejection Isn’t Real
Here is what most rejection-analysis programs never check. A spike in rejections looks identical on a chart whether it comes from a genuine process problem, a worn tool, or a miscalibrated inspection instrument — a vision camera reading incorrectly, a gauge that has drifted, or a sensor giving a false trigger. All three produce the same rejected-part count. Only one of them means the product is actually bad.
A false reject — a good part flagged as defective because the inspection system itself is wrong — is not a rare edge case. Cameras drift with lighting changes and lens contamination; gauges drift with wear and use. When that happens, a quality team can spend weeks chasing a “process problem” that does not exist, adjusting machines and retraining operators to fix a defect the product never actually had — while the real cause, an uncalibrated inspection instrument, goes untouched and keeps generating the same false signal. Rejection analysis that does not separate genuine process escapes from inspection-system error is analyzing the wrong half of the data.
How Zeptac Helps
Zeptac is a SaaS platform for the Testing, Inspection, Calibration, Certification, and Validation industry, built to catch exactly this blind spot before it wastes a quality team’s time:
- Calibration management: CalTac keeps every gauge, camera, and inspection instrument calibrated, in-date, and traceable, so a rejection spike can be checked against the instrument’s status before anyone chases a phantom process problem.
- Structured rejection tracking: TestTac structures defect classification, Pareto ranking, and root-cause tracking so rejection data drives action instead of just a monthly percentage.
- Reverse traceability: an out-of-tolerance instrument event flags every rejection it may have influenced, separating real defects from false ones.
- Real-time analytics: real-time dashboards and AI-assisted reports turn rejection data into a ranked, current list of what to fix.
The result is rejection analysis that answers the right question first: is this a real defect, or a measurement problem wearing a defect’s clothes?
Conclusion
Rejection analysis turns scrap and rework from a cost you absorb into a cause you can fix — classify defects, rank them by impact, trace the root cause, and act. But every one of those steps assumes the rejection itself is real. Before chasing a process fix, check the instrument that flagged the part. A miscalibrated gauge or camera can manufacture a defect rate out of thin air, and no amount of process tuning will ever bring that number down, because the product was never actually the problem.
| Know which rejects are real before you chase them
Looking to digitize rejection analysis, inspection, and calibration in your quality process? Zeptac’s TestTac and CalTac platforms separate genuine defects from instrument error, so your team fixes the right problem. Contact our team today to schedule a free demo. |
Frequently Asked Questions for Rejection Analysis in Manufacturing
Q1. What is rejection analysis in manufacturing?
Answer: Rejection analysis is the systematic study of why parts or products fail to meet specifications, using tools like defect classification, Pareto charts, and root-cause analysis to identify and fix the underlying cause of rejections rather than just tracking a rejection rate.
Q2. What is the difference between scrap and rework?
Answer: Scrap is a rejected part that cannot be economically brought back into specification and is written off as waste. Rework is a rejected part that can be corrected through additional processing. Tracking them separately reveals different problems and different costs.
Q3. What tools are used in rejection analysis?
Answer: Common tools include check sheets for consistent data capture, Pareto charts to rank causes by impact, cause-and-effect (fishbone) diagrams for root-cause analysis, control charts to track rejection rate over time, and disposition trend analysis to spot slow drift.
Q4. What causes high rejection rates in manufacturing?
Answer: Common causes include process or equipment issues, incoming material defects, human error, worn tooling, and design issues that do not account for real manufacturing tolerances. Each requires a different corrective action.
Q5. What is a false reject?
Answer: A false reject is a good part incorrectly flagged as defective because the inspection instrument, such as a vision camera or gauge, is reading incorrectly rather than because the product is actually out of specification. It produces the same rejection data as a real defect but requires a completely different fix.
Q6. How can you tell if a rejection spike is a real defect or an instrument error?
Answer: Check the calibration status of the inspection instrument involved before assuming a process problem. If the gauge, camera, or sensor is overdue for calibration or has drifted, the rejection spike may be a measurement artifact rather than a genuine quality issue.
Q7. Why does calibration matter for rejection analysis?
Answer: Every rejection decision depends on a measurement. If the instrument making that measurement is not calibrated and traceable, the rejection data itself cannot be trusted, and any root-cause analysis built on it risks solving a problem that does not exist while the real cause, the instrument, goes unaddressed.