
Work in progress is every unit that has entered production but is not yet a finished, sellable product. It is capital you have already spent and not yet recovered, which is why unmanaged WIP quietly strangles cash flow and stretches delivery times. Most explanations stop at a subtraction formula. This guide goes further: it shows how WIP connects to lead time through Little’s Law, how to reduce it without slowing output, and where a large share of it hides.
That hidden share is material waiting for an inspection result or a laboratory test. It looks like finished work, sits in a quarantine area or on an inspection bench, and rarely appears in anyone’s WIP count.
| What is work in progress (WIP)?
WIP is material and components that have entered production but are not yet finished goods. It sits between raw material and finished goods inventory. Unit flow: Ending WIP = Beginning WIP + Units started − Units finished. Accounting value: Ending WIP = Beginning WIP + Manufacturing costs added − Cost of goods manufactured. Little’s Law links WIP to speed: Lead time = WIP ÷ Throughput. At steady output, halving WIP halves lead time. Material waiting for inspection, test results, or quality release is WIP too, and often the least visible part of it. |
Work in Progress (WIP): The Formula, the Maths and the WIP Nobody Counts
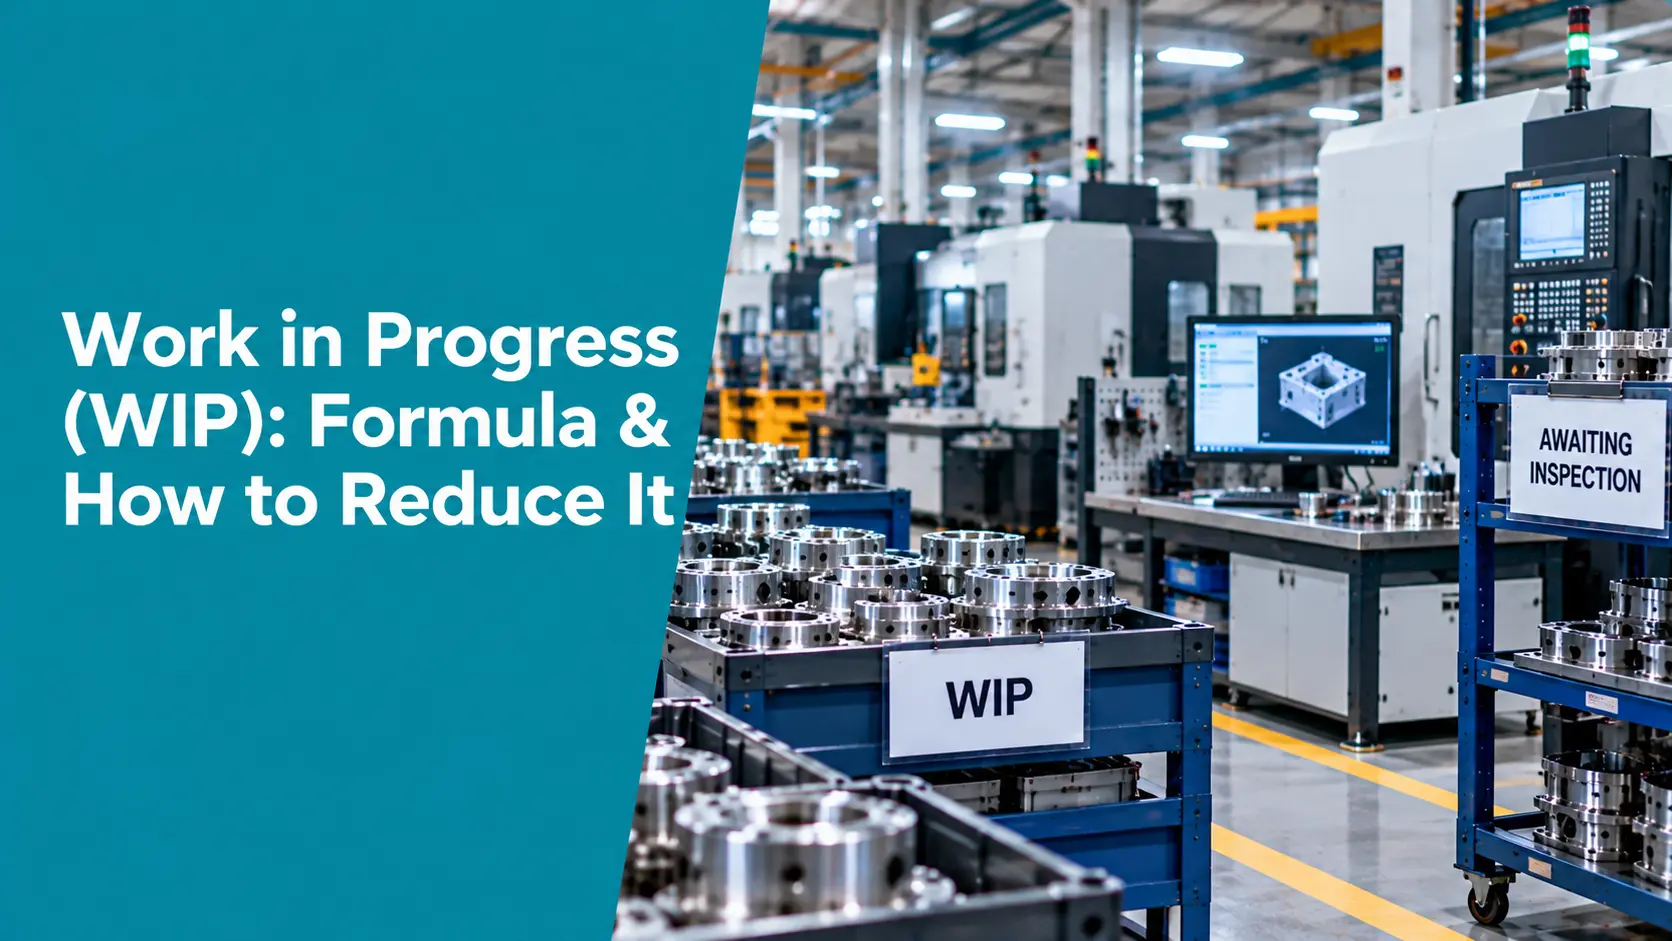
Why Work in Progress Matters
- It ties up cash. Every unit in process carries material, labour and overhead you cannot invoice yet.
- It lengthens lead time. More WIP means each unit waits longer between operations, so delivery dates become less predictable.
- It hides problems. Piles of WIP buffer breakdowns, quality issues and imbalances, so the real constraint stays invisible.
- It raises risk. Longer exposure to damage, obsolescence and engineering changes, and a larger batch affected when a defect is found.
WIP Formulas and Worked Examples
1. Unit flow (what is on the floor)
The simple balance tracks units. Take a line that begins the day with 140 units in process, releases 360 new units, and completes 400.
| Item | Units |
| Beginning WIP | 140 |
| + Units started | 360 |
| − Units finished | 400 |
| Ending WIP | 100 (140 + 360 − 400) |
2. Accounting value (what it is worth)
For financial reporting, WIP is valued in rupees, using the cost put into the work rather than a unit count. Under Ind AS 2 and IAS 2, inventories include goods in the process of production.
| Item | ₹ lakh |
| Beginning WIP value | 6.0 |
| + Manufacturing costs added (materials, labour, overhead) | 22.0 |
| − Cost of goods manufactured (completed work) | 23.5 |
| Ending WIP value | 4.5 (6.0 + 22.0 − 23.5) |
Both views matter. Units tell operations where work is stuck; value tells finance how much cash sits on the floor.
Little’s Law: The Link Between WIP and Lead Time
Little’s Law states that in a stable process, WIP equals throughput multiplied by lead time. Rearranged, lead time equals WIP divided by throughput. It holds for any stable system, so it applies to a machine cell, a whole plant, or an inspection queue.
| Scenario | WIP | Throughput | Lead time |
| Before | 150 units | 25 units/hour | 6 hours |
| After WIP reduction | 100 units | 25 units/hour | 4 hours |
Output has not changed, yet every unit now reaches the customer two hours sooner. This is why WIP reduction speeds delivery rather than slowing production.
Warning Signs of Excess WIP
- Parts pile up in front of specific machines or stations.
- Lead times keep growing even though machines look busy.
- Nobody can quickly say where a particular order is.
- Finished-goods targets are missed despite a busy floor.
- The WIP figure from yesterday does not match what you see today.
How to Reduce WIP Without Slowing Production
- Baseline first. Measure WIP by stage so you know where it accumulates.
- Find the bottleneck. WIP builds up in front of the constraint. Improve that station before spending effort elsewhere.
- Set WIP limits. Cap the units allowed at each station and stop releasing upstream work when the cap is reached (the kanban principle).
- Balance the line. Redistribute work or add capacity so stations flow at a similar pace.
- Move towards pull. Release work only when downstream capacity signals readiness, rather than pushing to a schedule.
The WIP Nobody Counts: Waiting on a Test or Inspection Result
Count WIP by walking the floor, and you will find it in front of machines. Look in the inspection area, the quarantine cage, and the laboratory sample queue, and you will find more. Material that has finished its last process step but cannot move until someone confirms it is good is still work in progress, because the order is not complete.
| Where measurement creates WIP
Inspection queues: parts wait for first-piece approval, a CMM slot, or a free gauge. By Little’s Law, a queue of 90 parts at an inspection capacity of 30 parts per hour adds three hours to every unit’s lead time. Regulated quarantine: in pharmaceutical and similar manufacturing, EU GMP Chapter 5 expects incoming materials and finished products to be quarantined until released. Batches therefore sit as WIP or stock until the laboratory reports and Quality releases them, so lab turnaround time sets how long cash stays tied up. Blocked testing: when a required instrument is overdue for calibration or out of service, tests queue behind it, and the material waiting on those results grows. |
Reducing laboratory and inspection turnaround time is therefore a WIP lever, not just a quality metric. Faster sample registration, scheduling that respects instrument availability, quicker result review, and faster report issuance all shorten the time material spends waiting for release.
Compliance and Regulatory Considerations
Release controls are not optional waiting time to be engineered away. EU GMP Chapter 5 requires quarantine until release and clear status identification, ISO 9001 clause 8.6 requires that release of products does not proceed until planned verification is complete, and ISO/IEC 17025 expects test results to be issued on calibrated, traceable equipment. The way to cut WIP safely is to shorten the path to a trustworthy result, not to skip the check.
Best Practices
- Count inspection and quarantine as WIP stages. Give them their own line in your WIP view, with age as well as quantity.
- Track age, not just count. A small pile that has waited three days is worse than a large pile that moves.
- Prioritise by age and risk. Work the oldest and highest-risk items in the inspection and lab queues first.
- Keep instruments available. Schedule calibration so testing capacity is never lost unexpectedly to an overdue instrument.
- Measure turnaround time. Track sample-to-report time as a KPI and review it alongside WIP.
- Update WIP in real time. A figure that is hours old describes a shop floor that no longer exists.
The Role of Digital Transformation, AI, and IoT
Real-time capture of production events replaces end-of-shift estimates, so WIP by stage is a live number. Extending the same visibility to inspection and laboratory queues closes the gap: samples and inspection jobs are tracked from registration to release, with turnaround time and ageing visible. Automated report generation removes one of the slowest manual steps between a finished test and a release decision.
How Zeptac Helps
- Real-time monitoring: Captures starts, stops, and completions automatically, giving stage-wise visibility of work on the floor.
- TestTac: Tracks samples and test jobs from registration to report, with scheduling and turnaround visibility, so material waiting on results is no longer invisible.
- AI-powered report generation: Shortens the step from completed test to issued report.
- CalTac: Keeps calibration due dates visible so instruments are available when tests need them.
- Out-of-tolerance workflow: When an instrument fails, it identifies affected results quickly, limiting how much material has to be held.
Real-World Use Case
A pharmaceutical formulation unit measured WIP only on the production floor and judged it acceptable. Mapping the full flow showed that finished batches routinely waited several days for release because laboratory results queued behind two instruments with unpredictable availability and manual report preparation. Scheduling calibration around the testing calendar, tracking each sample’s turnaround time and automating report drafting shortened the wait. The batches reached release sooner without any change to the release criteria.
Future Trends
- Live value stream views: WIP, lead time, and turnaround shown together by stage.
- Predictive queue management: Models that forecast where WIP will accumulate before it does.
- Automated review and release support: Faster, rule-based checking of results and records ahead of human approval.
Conclusion
Work in progress is more than a subtraction formula. It is the cash and time tied up between start and finish, linked to lead time by Little’s Law. Reduce it by finding the bottleneck, limiting what enters, and pulling work through. Then look past the machines to the inspection bench and the laboratory queue, where material waiting for a result is work in progress that most plants never count.
| Count the WIP that waits on a result
Zeptac’s TestTac, CalTac, and real-time monitoring give manufacturers and laboratories live visibility of work on the floor and in the lab queue. Contact our team today to schedule a free demo → |
Frequently Asked Questions for Work in Progress
Q1. What is work in progress (WIP)?
Answer: Work in progress is material and components that have entered production but are not yet finished goods. It represents money already spent that has not yet been recovered through sales.
Q2. What is the WIP formula?
Answer: For units, Ending WIP = Beginning WIP + Units started − Units finished. For accounting value, Ending WIP = Beginning WIP + Manufacturing costs added − Cost of goods manufactured.
Q3. What is Little’s Law in manufacturing?
Answer: Little’s Law states that in a stable process, WIP equals throughput multiplied by lead time. At constant throughput, reducing WIP reduces lead time in direct proportion.
Q4. What causes high WIP?
Answer: Bottleneck stations, unbalanced lines, push scheduling that releases work faster than it can be processed, and queues for inspection, testing, or quality release.
Q5. How do you reduce WIP?
Answer: Measure a baseline by stage, find the bottleneck, set WIP limits, balance the line, and move towards pull scheduling, while shortening inspection and laboratory turnaround.
Q6. Is material waiting for inspection or lab results WIP?
Answer: Yes. Material that has finished its last process step but cannot move on until it is inspected, tested, or released is still work in progress, because the order is not complete.
Q7. How does lab turnaround time affect WIP?
Answer: In regulated manufacturing, materials and batches are quarantined until quality control releases them. The longer testing and reporting take, the longer that material remains in process or in stock, tying up cash.